Monitoring Cassandra with Datadog
Monitoring Cassandra gives you a range of metrics that allow you to explore the health of your data store in great depth. But to get lasting value from those metrics, you need a robust monitoring system that collects, aggregates, and visualizes your Cassandra metrics—and alerts you when things go awry. In this post, we’ll show you how to set up Cassandra monitoring in Datadog.
Integrating Datadog and Cassandra
Install the Datadog Agent
The Datadog Agent is the open source software that collects and reports metrics from your hosts so that you can view and monitor them in Datadog. Installing the Agent usually takes just a single command.
Install instructions for a variety of platforms are available here.
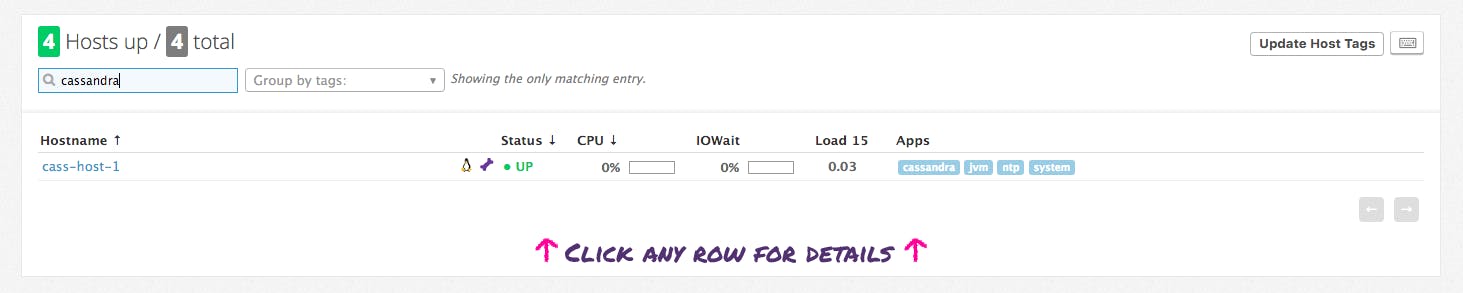
As soon as your Agent is up and running, you should see your host reporting metrics in your Datadog account.
Configure the Agent
Next you’ll need to create a simple Cassandra configuration file for the Agent. For Linux hosts, the configuration files are typically located in /etc/dd-agent/conf.d/, but you can find OS-specific config information here.
The Agent configuration file cassandra.yaml is where you provide the hostname and the port (note that Cassandra uses port 7199 by default for JMX monitoring), as well as your JMX authentication credentials (if enabled on your cluster). You can also use the config to define which Cassandra metrics Datadog will collect, or to apply tags to your Cassandra instances for filtering and aggregating your metrics. The Agent ships with a cassandra.yaml.example template that enables you to monitor all of the metrics described in Part 1 of this series.
Restart the Agent
You must restart the Agent to load your new configuration file. The restart command varies somewhat by platform (see the specific commands for your platform here). For Debian/Ubuntu:sudo /etc/init.d/datadog-agent restart
Verify the configuration settings
To check that Datadog and Cassandra are properly integrated, run the Datadog info command. The command for each platform is available here. For Debian/Ubuntu the command is:sudo /etc/init.d/datadog-agent info
If the configuration is correct, you will see a section like this in the info output:
Checks
  ======

    [...]

    cassandra
    ---------
      - instance #cassandra-localhost [OK] collected 81 metrics
      - Collected 81 metrics, 0 events & 0 service checks
Install the integration
Finally, switch on the Cassandra integration inside your Datadog account. It’s as simple as clicking the “Install Integration” button under the Configuration tab in the Cassandra integration settings of your Datadog account.Metrics!
Once the Agent is properly configured, you will see dozens of Cassandra metrics available for monitoring, graphing, and correlation in Datadog.
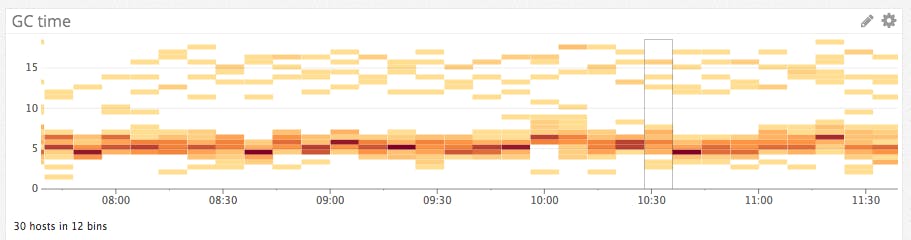
You can easily create a comprehensive dashboard for your data store and its associated systems by graphing the Cassandra metrics from Part 1 with important metrics from outside Cassandra. For example, you may want to monitor system metrics, such as CPU and memory usage, as well as JVM metrics, such as the duration of stop-the-world garbage collection (GC) episodes, which is captured by the jvm.gc.parnew.time metric:
You can also manipulate the raw metrics that come out of Cassandra into something much more usable. For instance, recent versions of Cassandra expose metrics on total latency but not recent latency, which is the metric you will likely want. In Datadog you can easily extract and graph real-time latency, resampled several times a minute, using two metrics scoped to clientrequest:read:
cassandra.total_latency.count(the total number of microseconds elapsed in servicing client read requests)
cassandra.latency.count (the total number of read requests processed)
By taking the diffs of each metric at every sampling interval and dividing them, you can monitor the real-time read latency (divided by 1,000 here to measure latency in milliseconds). In Datadog this just takes a few clicks in the graph editor:

Monitoring Cassandra
Once Datadog is capturing and visualizing your metrics, you will likely want to set up some monitors to keep watch over your metrics—and to alert you when there are problems.
Datadog allows you to monitor individual hosts, services, processes, and metrics—or virtually any combination thereof. For instance, you can monitor all of your hosts in a certain availability zone, or you can monitor a single key metric being reported by each of your Cassandra hosts. As an example, you can set a change alert to notify you if your request throughput drops by a certain percentage in a short time, which can be a high-level indicator of problems in your systems.


This post is so interactive and informative.keep updating more information...
ReplyDeleteAws Training In Mumbai
Aws Training In Ahmedabad
Aws Training In Kochi
Aws Training In Trivandrum
Aws Training In Kolkata
AWS Solution Architect
AWS